Animating systems diagrams with draw.io

Diagrams are fantastic tools for explaining complex systems. They act as a visual map, allowing viewers to grasp how various components interact and connect in a single glance.

However, static diagrams sometimes lack the ability to convey intricate processes fully. Imagine presenting a complex system diagram – you can narrate, draw focus to specific elements, and guide your audience through the visual representation. However one of the primary goals of diagrams is to provide a clear explanation without needing a constant narration.

Animating diagrams, particularly the flow between different components, bridges the gap between static images and detailed narration. Animations act as a visual guide, directing viewers’ attention and highlighting the order of operations within the system.

Imagine seeing a building’s piping system statically on paper (which is still an amazing way to give information about, well the piping in a building).

But imagine the drawing animates and shows the direction of the flow of water or sewer system. Increasing the information signal using animations, amplifies the impact of the system diagram.

I recently ended up using Drawing.io that has easy way to do this.

Most of the time the connections between components of the diagrams are the pieces we want to animate.

I looked for this in a lot of other tools I used in the past. Both proper diagramming tools like lucid charts, mermaid, excalidraw, and miro. figma/figjam and general presentation apps like Keynote, and PowerPoint. None have easy animation options.

The way I started doing easy animations, is to use my existing drawings, import them as static jpeg/png or SVG into draw.io then draw a connector line over my existing lines, give it a white color and make it thick, then check it’s “animation” option to animate white dashes lines that animate over my existing connector lines, making them animated.

Beyond Animation, I like draw.io because it’s a fantastic drawing tool. It’s open-source and free to use and contribute to. Works cross-platform. It has a lot of drawing elements, and you can import your own png, svg icons to your library.

You can install draw.io on your desktop (on Mac, using homebrew, as simple as brew install –cask drawio), use the online version for free, or signup for cloud plans to collaborate with your team.

Creating sequence diagrams using mermaidjs to map out your user journey

I want to talk about an effective product planning process I’ve been following recently.

Why to do user journey thinking?

In your product, single most important thing is to put your users first. Nothing matters other than how your users perceive your product. “Users” is a very general and broad definition and often used without much nuance of different user personas. Anybody who interacts with your product is your user, including you as “admin” or “owner”. There are many other user personas you may need to consider when designing a feature. It’s also important to think maturity of your users adoption of your product. A user who is new to your overall product may take your new feature in a different way than a power user. Similarly, your small biz client’s users may need different things than your enterprise client.

User journeys can easily highlight differences between these users and how they interact with your product or each other. Your feature may require a tech lead to configure things first in your product, then tell their editors to do other things while editors may need to work with their development team to accomplish other goals. So a simple looking feature may require couple different team members to collaborate and communicate.

Sequence Diagrams

Sequence diagram is a type of diagram that does great job telling 2 things:

  • How many participants in a journey
  • The order of things between which participants happen.

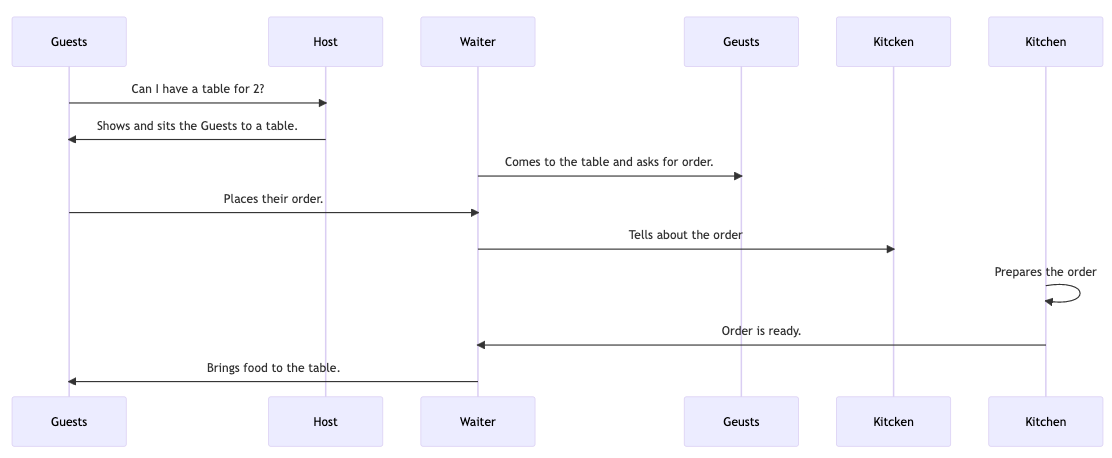
And example to this would be, order a food at a restaurant.

Participants:

  • Guest
  • Host
  • Waiter
  • Kitchen

And maybe steps would be:

  • Guest asks Host can I have a table for 2?
  • Host shows and sits the Guests to a table.
  • Waiter comes to the table and asks for order from Guests.
  • Guests places their order.
  • Waiter tells Kitchen about the order
  • Kitchen prepares the order
  • Kitchen tells Waiter that order is ready.
  • Waiter brings food to the table to the Guests

A journey like this can be visualized in a sequence diagram like this:

sequenceDiagram

Guests ->> Host: Can I have a table for 2?
Host ->> Guests: Shows and sits the Guests to a table.
Waiter ->> Geusts: Comes to the table and asks for order.
Guests ->> Waiter: Places their order.
Waiter ->> Kitcken: Tells about the order
Kitchen ->> Kitchen: Prepares the order
Kitchen ->> Waiter: Order is ready.
Waiter ->> Guests: Brings food to the table.

As you see, if we were to design a food ordering feature, we may want to visualize traditional way of ordering food and also visualize our better food ordering experience with our new product feature.

How about user stories?

User stories are key when developing a product. Written user stories are best to summarize a capability, a feature or a user goal. A traditional story would look like:

As a < persona >, I want to < action >, so that I can get < benefit>

User stories written in this traditional sense brings clear, structured, short and written form to your product features. They are essential when the engineering team is planning their implementation in project management tools. Often a user story is planned as a story and engineering team can break it down to sub-tasks about the implementation steps. If user story is describing a bigger goal, it can be planned as an epic and sub stories and tasks can be planned under it.

Let’s roll back to our user journey mapping with sequence diagrams. As you see here, this process does not replace but complements user stories. It makes sense to make the user journey mapping practice before finalizing user stories when planning a product.

Using Mermaid.js for quick Diagramming Tool

Mermaid is an open source software that draws different types of diagrams using simple structured text. One of the diagram types mermaid support is sequence diagrams.

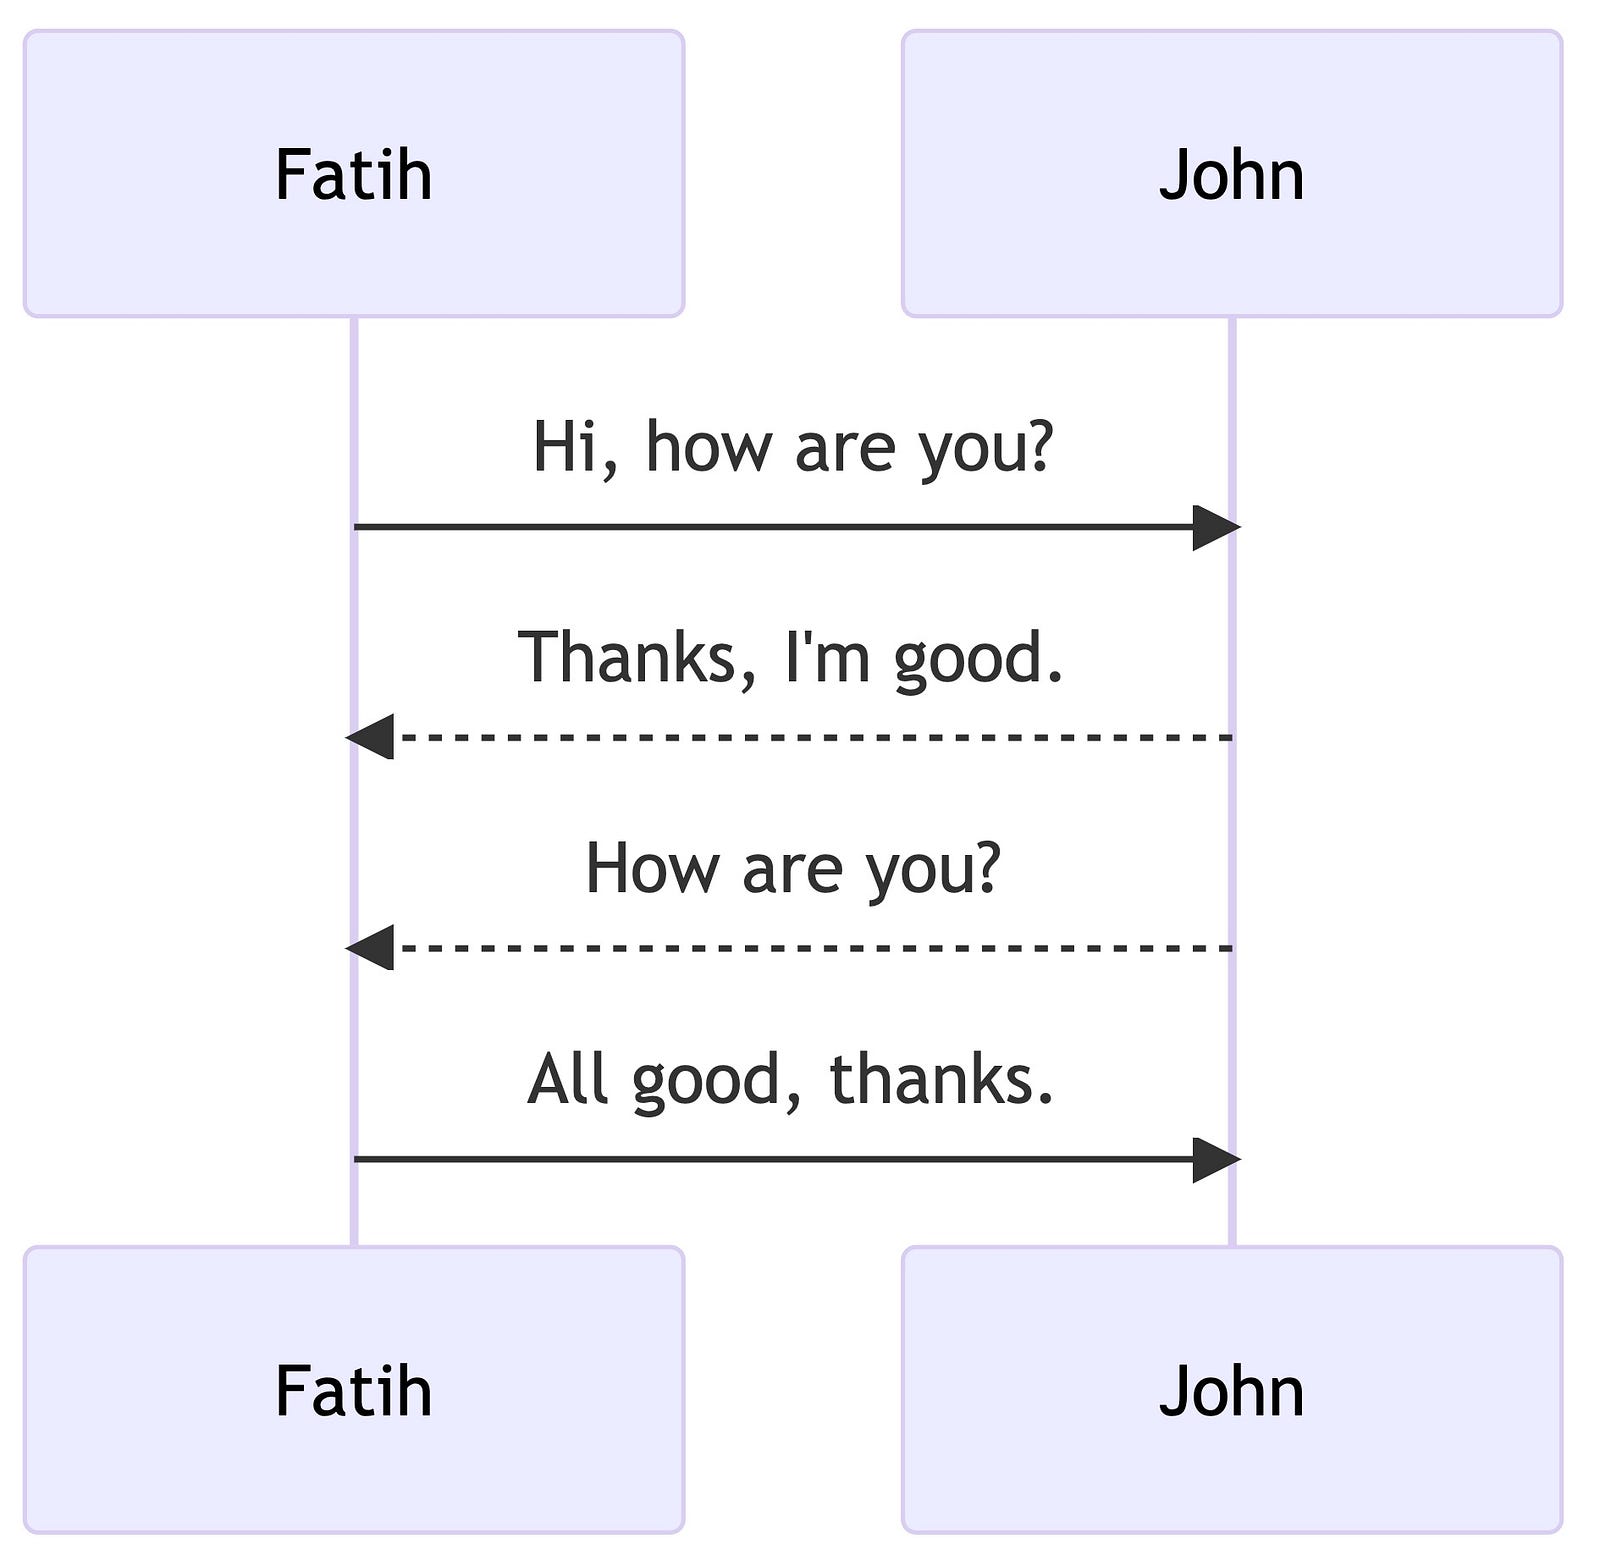
Mermaid draws a sequence diagram using a text formatted like this:

sequenceDiagram

Fatih ->> John: Hi, how are you?
John -->> Fatih: Thanks, I'm good.
John -->> Fatih: How are you?
Fatih ->> John: All good, thanks.

Renders to a nice sequence diagram:

Mermaid Tooling

I’ve covered how to edit and manage mermaid diagrams in your favorite tools in a past article.

You can also alternatively create similar diagrams in free-form mode with excalidraw which I also like. I’ve talked about excalidraw in my previous posts. It will give you way more control to make your diagrams look exactly like you want but obviously it will take much more time to create one compared to mermaid.js diagrams.

Editing and previewing Mermaid diagrams on your docs (markdown, github, notion, confluence)

Mermaid.js is one of my recent favorite tools I’ve added to my toolbox. Mermaid.js is an open-source diagramming tool that converts plain structured text and renders diagrams as SVG or PNG images. You can use the following tools to render and save mermaid diagrams on your documents but there are better ways to create, edit and maintain your mermaid diagrams in your favorite documentation tools. Because of its popularity, a lot of documentation tool supports the mermaid either out of the box or with add-ons.

Mermaid Live Editor

Let’s start with the obvious option. Mermaid.js has an online editor that is free to use and does not require anything. You can quickly start creating diagrams, and share or embed them in your favorite places.

Try: https://mermaid.live

Markdown editors mermaid support

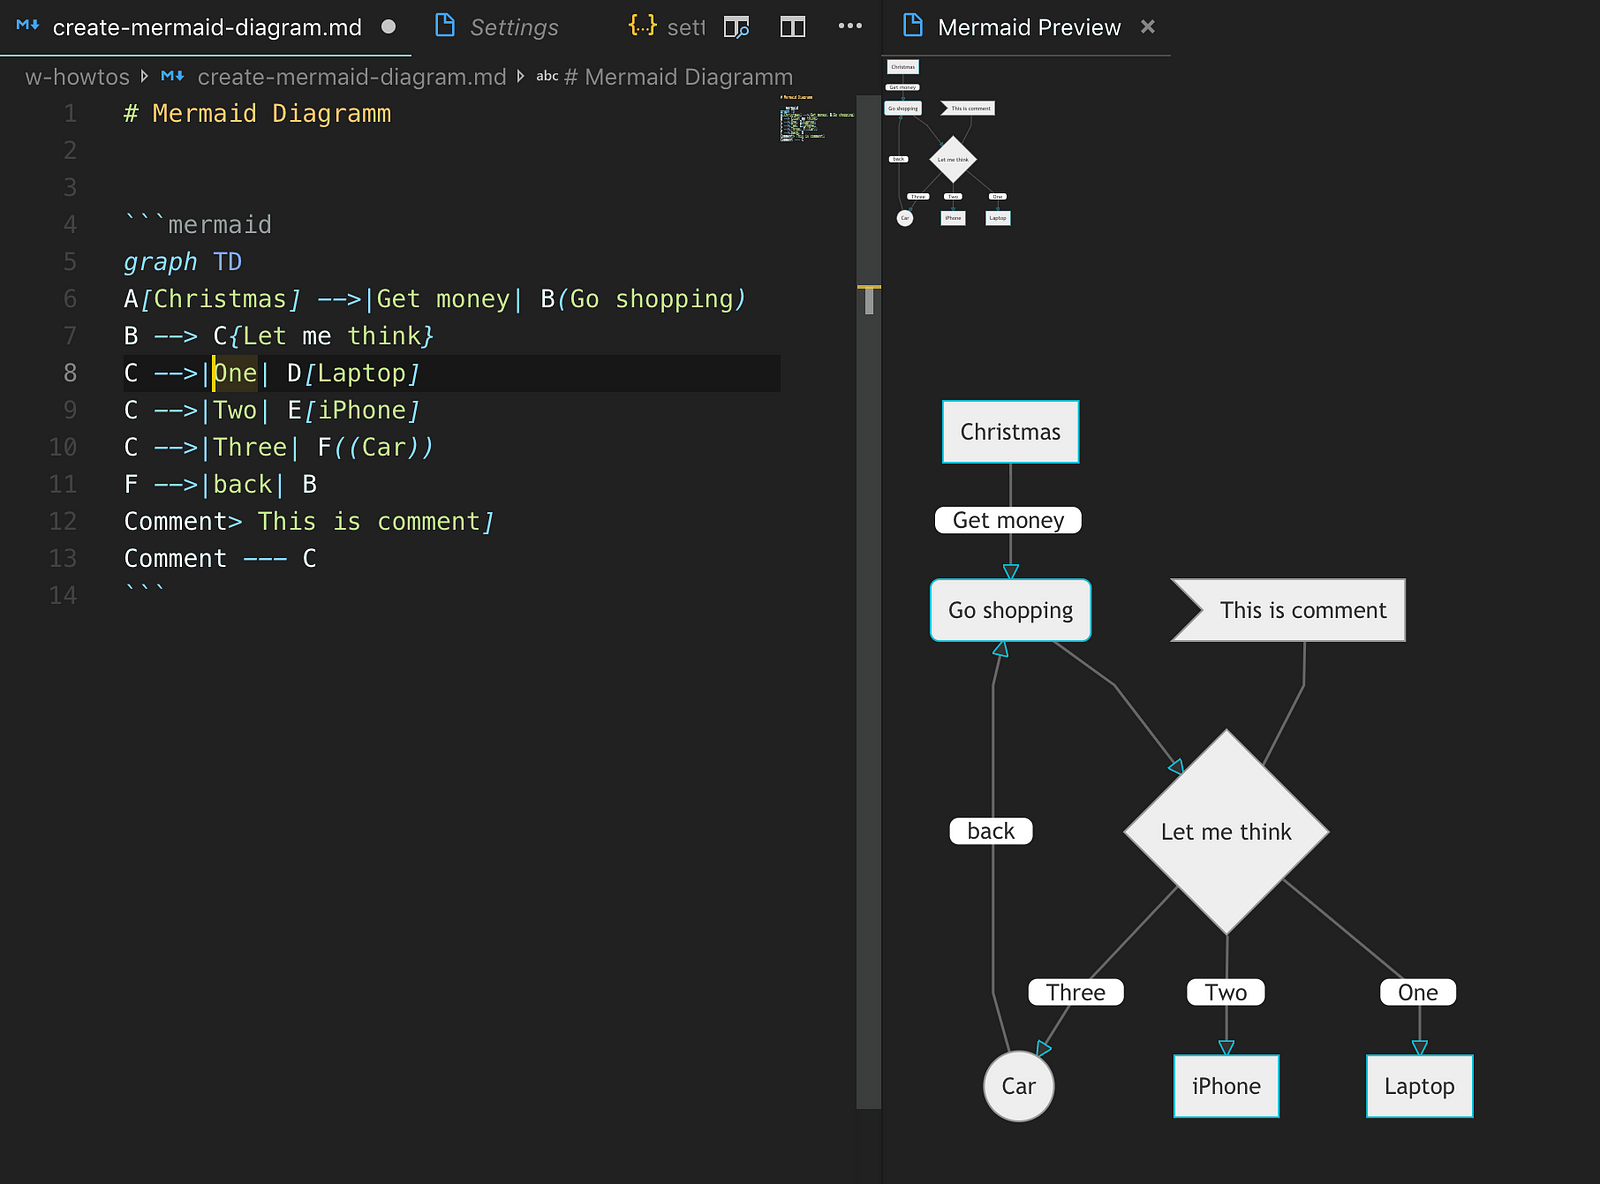
I personally use Visual Studio Code as my markdown editor and I use the Markdown Enhanced Preview extension to preview additional markdown features that include mermaid syntax to be rendered as diagrams.

https://marketplace.visualstudio.com/items?itemName=shd101wyy.markdown-preview-enhanced

I’ve seen most of the text editors that have markdown support to have mermaid support included by default or with add-ons/extensions.

Documentation tools mermaid support

Most tools work with markdown or support markdown features, recognize mermaid.js, and provide out-of-the-box mermaid diagrams support.

Github.com markdown mermaid support

Github started to support mermaid diagrams rendered instead of code blocks if the code block is marked as mermaid syntax.

https://github.blog/2022-02-14-include-diagrams-markdown-files-mermaid/

It works out of the box and when a markdown file is rendered in the preview mode in your repo, it will show the diagram as SVG rendering inline instead of the code block.

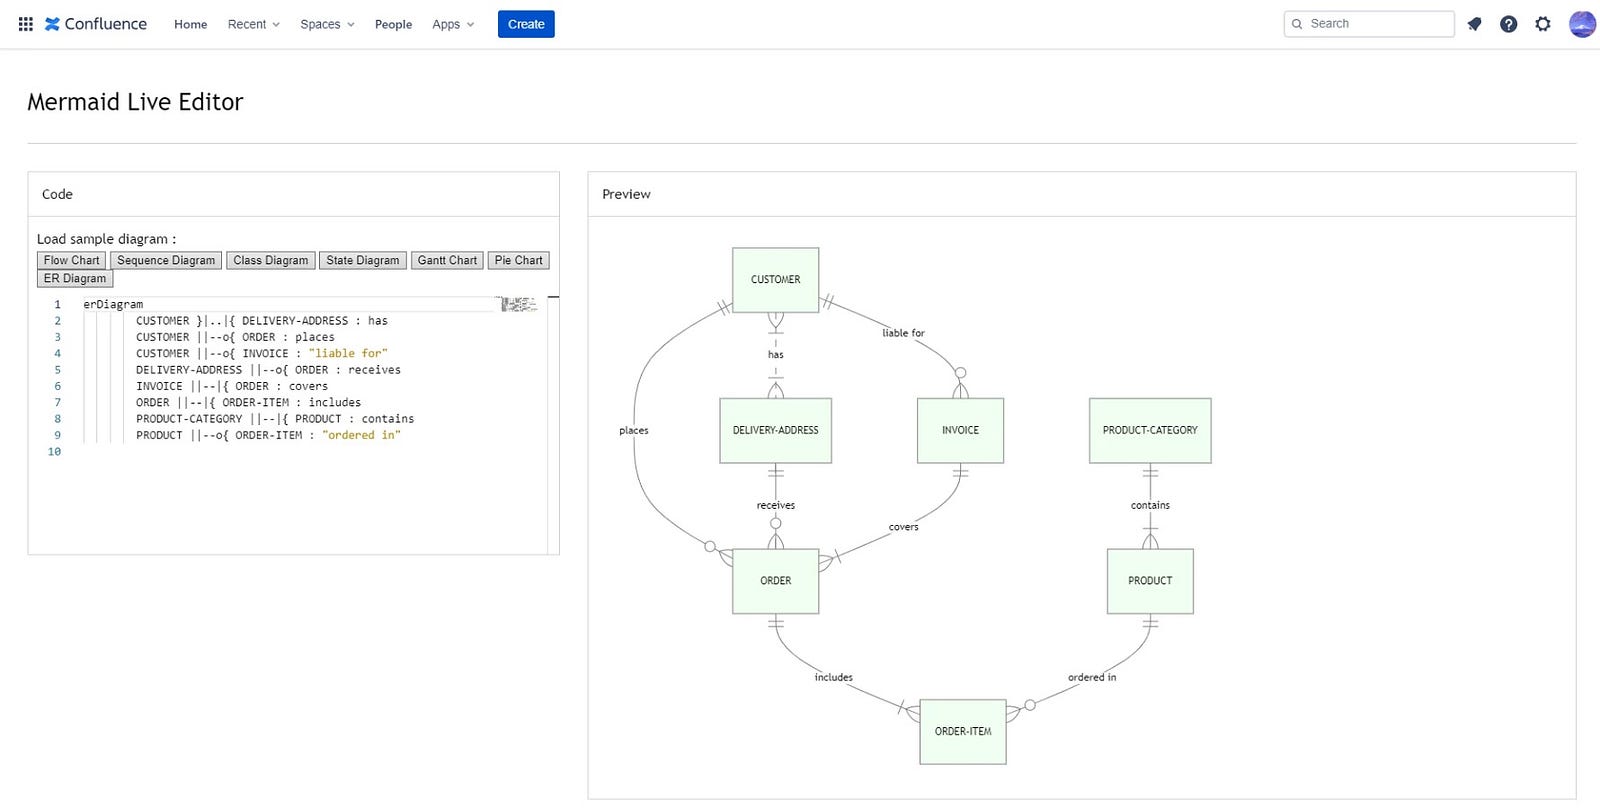
Confluence mermaid Plugin

There is a free confluence add-on that adds a page macro that you can insert a mermaid diagram by adding the source diagram text once you insert it to the page, it renders it as an SVG image. It can be easily edited on the page so there is no need to render, export, and insert as an image manually.

https://marketplace.atlassian.com/apps/1222792/mermaid-integration-for-confluence?tab=overview&hosting=cloud

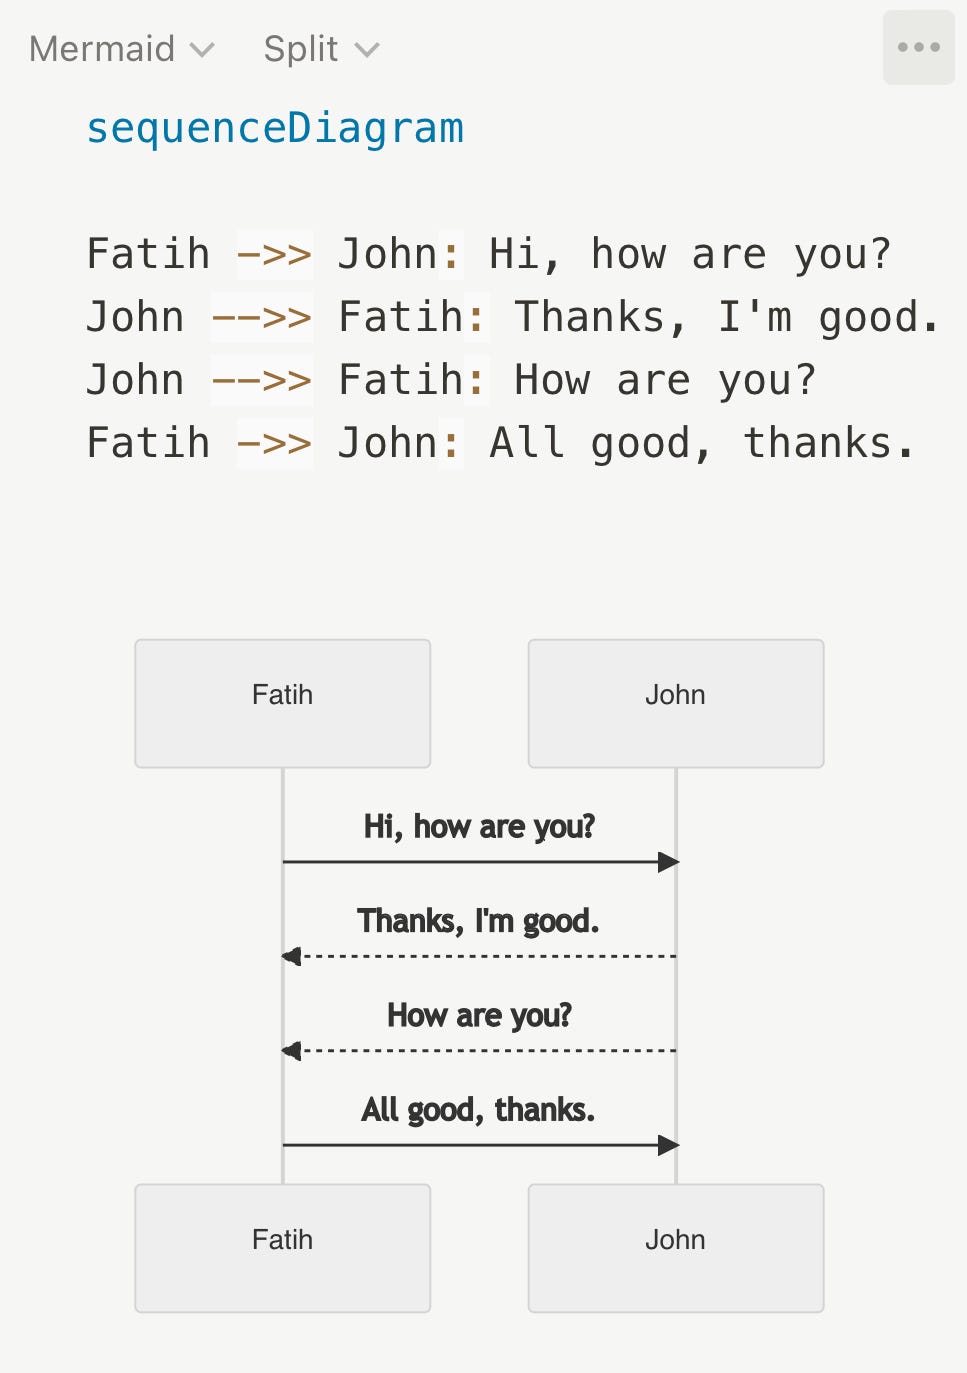
Notion mermaid support

Any code block that is selected as mermaid syntax, gets a mermaid diagram rendered in the code block. It has diagram size limited to the code block width which makes it hard to see large diagrams, but it does render small-size diagrams or things like pie charts powered by mermaid syntax well.

Create quick diagrams and Wireframes using Excalidraw + VSCode

There are probably tons of both diagramming tools as well as wireframing tools out there. And I have been using most of those throughout my profession.

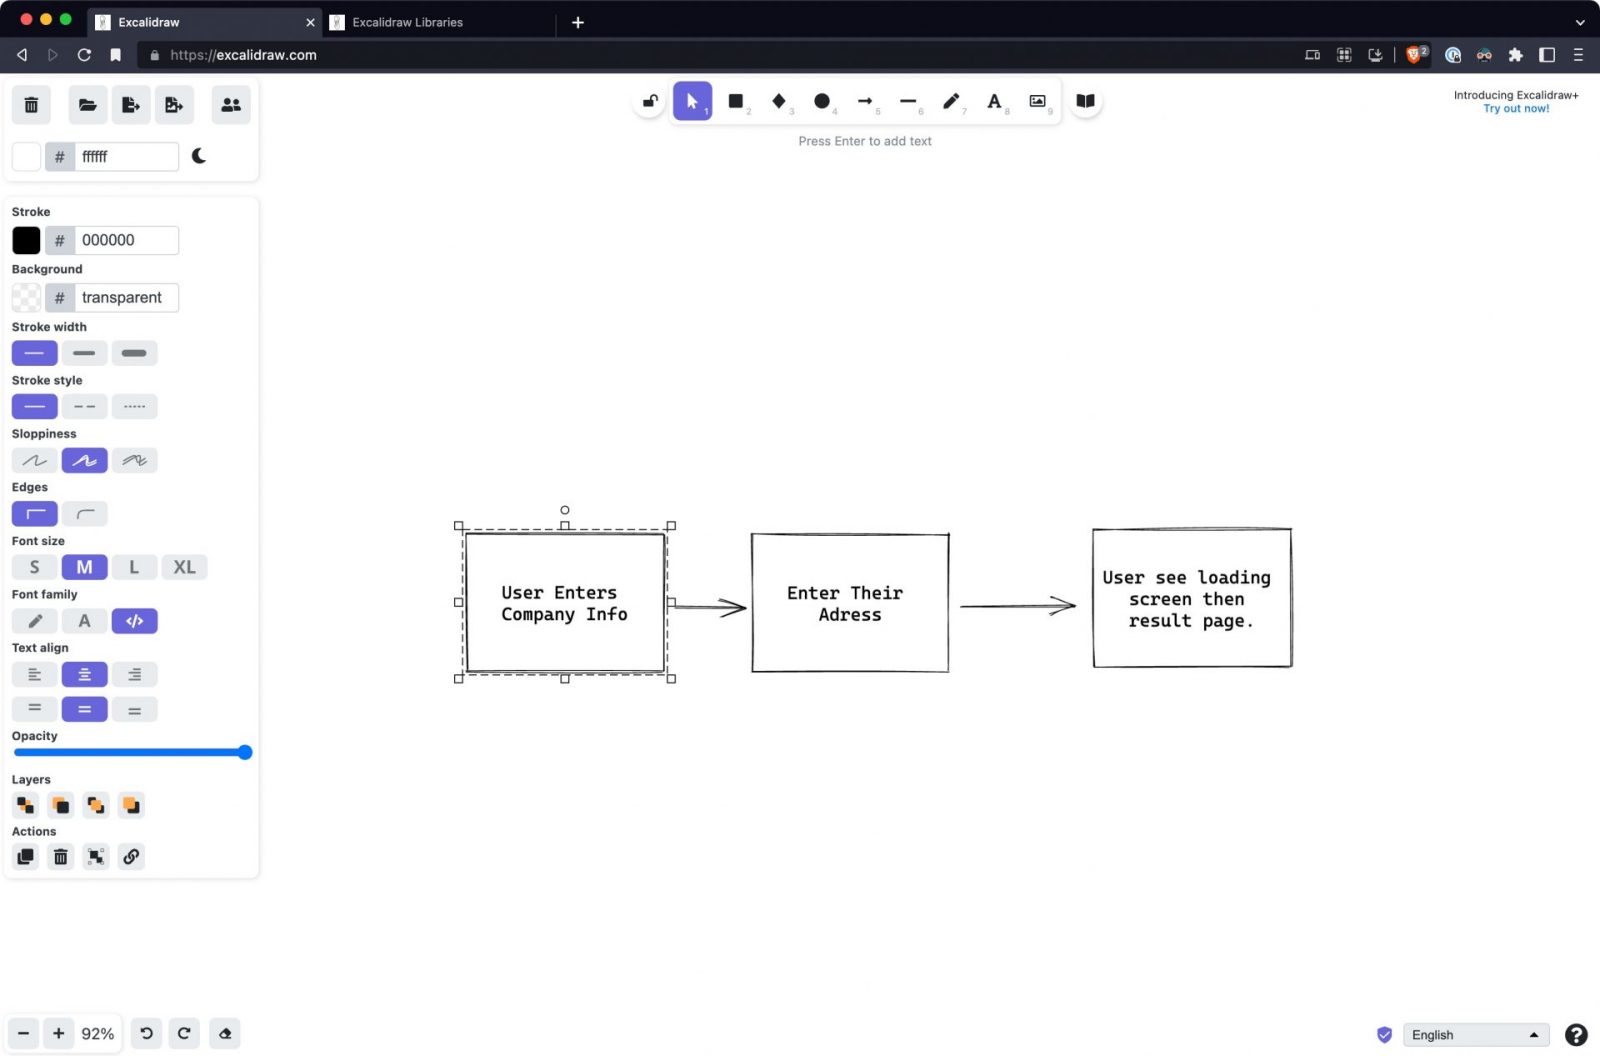
I want to talk about my recent favorite “excalidraw” that I made it a quick-note style using its Visual Studio Code extension and some bash + Alfred automation on mac (that can be easily replicated in other OSes).

Let’s start with what Excalidraw is…

Excalidraw is an open-source, react-based, web-based drawing tool. It comes with a limited set of functions in a minimal control panel but the batteries-included for all you need – for what it does in my opinion.

It’s a diagramming app after all. But not just that.

It’s Open source

https://github.com/excalidraw/excalidraw

It’s portable – No app is required

Available at https://excalidraw.com/

It stores and auto-saves your open file in the local storage.

It also has some collaborative online real-time editing mode which is awesome.

Saves editable copy inside share-ready PNG or SVG files

A very smart thing excalidraw does is save its editable meta in PNG or SVG exported/saved file. It definitely makes the file size larger, if you are using a lot of bitmap icons, screenshots, and all. If not, the png file you save and slap in slack, emails are actually going to be excalidraw openable and editable.

The easiest way to do this without any option is to name your file with .excalidraw.png or .excalidraw.svg extension. When opening this file with excalidraw online or VSCode, it will automatically open the editable version in less than a second. You make edits and just save…

Embeddable

If you are developing a react-based application, you can actually embed excalidraw as part of your app and provide diagramming support.

import { useState, useEffect } from "react";
export default function IndexPage() {
  const [Comp, setComp] = useState(null);
  useEffect(() => {
    import("@excalidraw/excalidraw").then((comp) => setComp(comp.default));
  }, []);
  return <>{Comp && <Comp />}</>;
}

https://www.npmjs.com/package/@excalidraw/excalidraw

Have a component library with everything you’ll need

https://libraries.excalidraw.com/

VSCode Extension

Even though I love it runs on the browser and auto-saves. I prefer to have this ready under my toolkit offline or faster open/edit/save files.

If you are a developer, good chance that you are using vscode daily – Or if you don’t, vscode is a very lightweight editor that is worth to use it only for excalidraw. For the ones who uses vscode actively, this means no extra tool is needed. Both vscode and excalidraw renders very fast and don’t use much system resources.

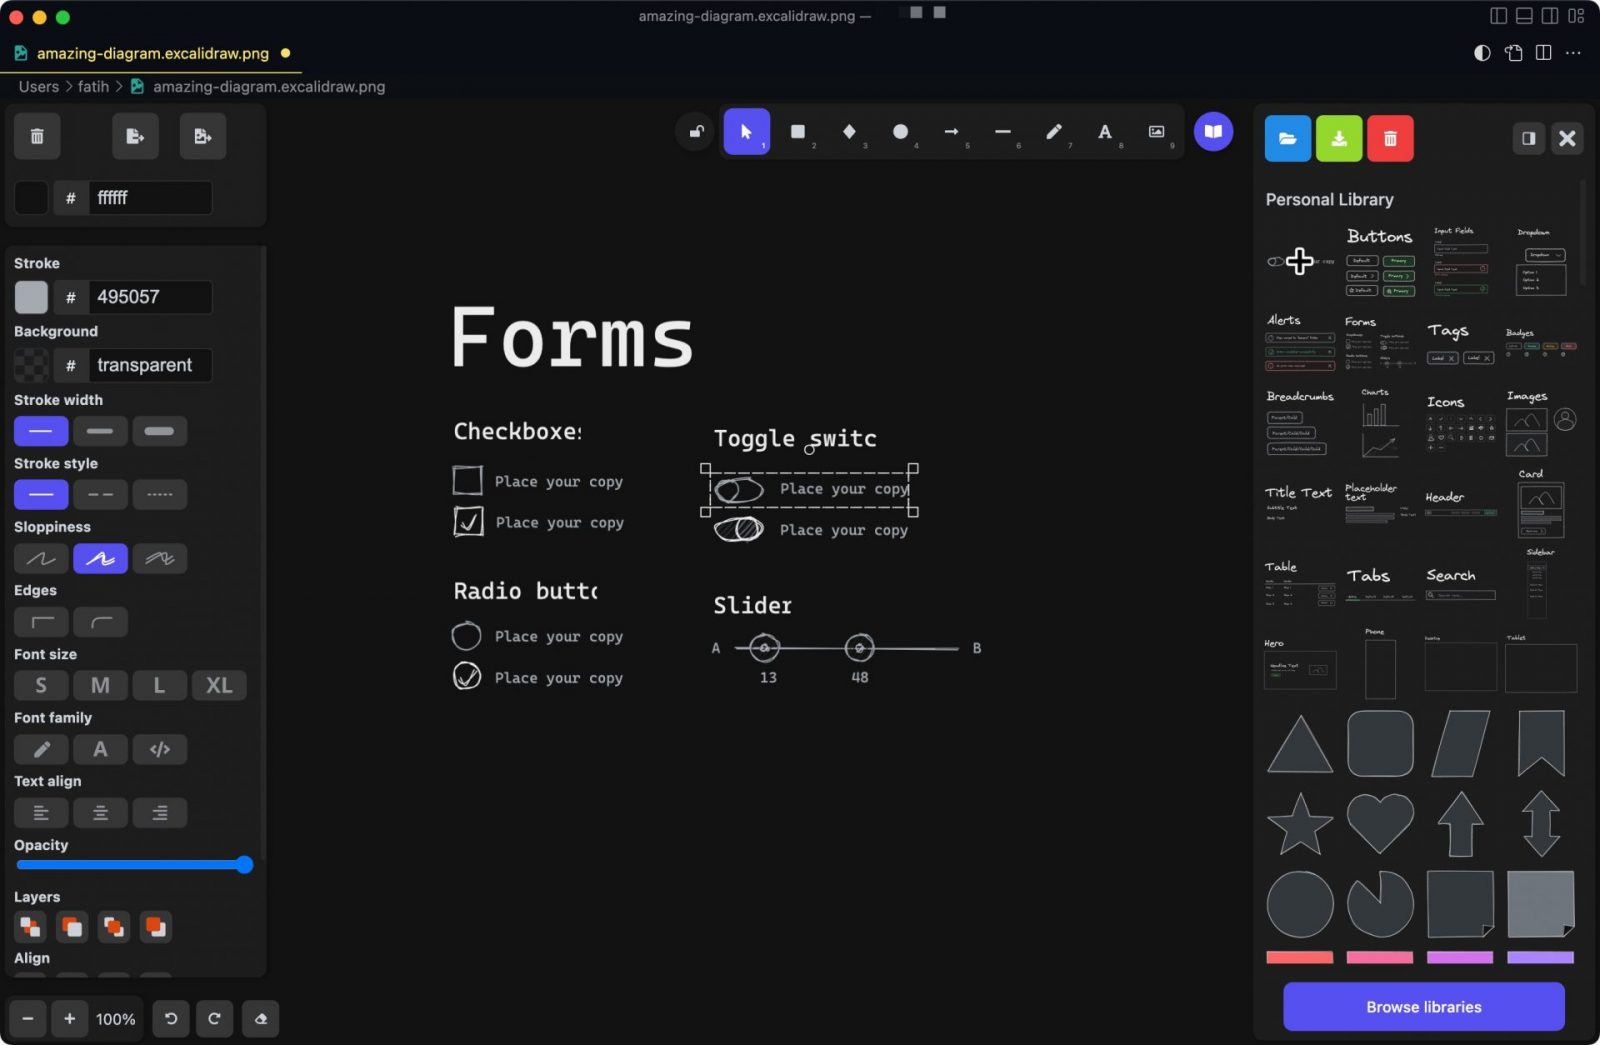
Another magic feature I like using excalidraw in its VSCode extension is that you just open .excalidraw.png (or svg) files by dragging and dropping them in vscode, making edits, and save. No export/re-export is needed. You can just use the saved PNG which includes both the final rendered PNG and the source content in the same file.

This also makes a lot of sense for teams who use their codebase to document their stuff in markdown files. Excalidraw diagrams are the perfect companion for CVS-stored documentation.

Quick Create Digram

A final trick I do that makes my day-to-day very convenient is, having a shortcut to create an empty excalidraw.png file on my desktop and open it in VSCode, so I can start diagramming or wireframing in seconds without needing to open the wireframe app, create a new empty project or file…

The way I do this is by having a bash alias that is registered in my dotfiles/my-aliases: ned abbreviation of “New Excalidraw file on Desktop”.

function ned(){
  OLD_IFS="$IFS"
  IFS='-'
  NED_FILE="$HOME/Desktop/$*.excalidraw.png"
  IFS=$OLD_IFS
  echo "Created $NED_FILE"
  touch $NED_FILE
  code $NED_FILE
}

Then calling this alias either from the command line (if I’m already there) or by using an Alfred custom workflow that calls the same bash alias.

Then viola, start dropping things from my library and quickly wireframing an idea I’m thinking:

And finally, just save and share the png file in your favorite way…

Happy diagramming, wireframing ✍️